Getting started with the Dusk Mobile Intelligent Operations Platform
Visualisation of data has become the next frontier following on from the creation of data. In an incredible statistic, over the last 2 years alone 90 percent of the data in the world was generated! 2.5 quintillion bytes of data are created every single day and with growth of the Internet of Things (IoT), this is only going to increase at an exponential rate.
Visualisation of data has been around for many years in varying forms, from reports through to dashboards and an array of business intelligence tools. These work once they are setup but can require specific technical skills, large budgets, limited cross pollination of data or just deliver the information after the fact. Calls, tickets, emails then follow to take action. This has become a black hole for businesses and the larger the business, the bigger the problem. So, we set about changing that.
We built the dynamic Intelligent Operations Platform (IOP) to allow businesses of all sizes access to greater insights, leading to actionable outcomes for collaborative work management. On top of this, our goal was to do this in near real time where possible, which required additional complimentary modules and partnerships.
Working closely with a group of customers, the IOP has been built from the ground up to be an API driven, code free integration and collaboration platform that is easy to setup and delivers a rapid ROI, even during a Proof of Concept. You can become a work management leader today.
Over the subsequent posts, we’ll explore the capabilities and show how we provide you with the power to take the simplicity of WordPress to the Enterprise.
Let’s get started
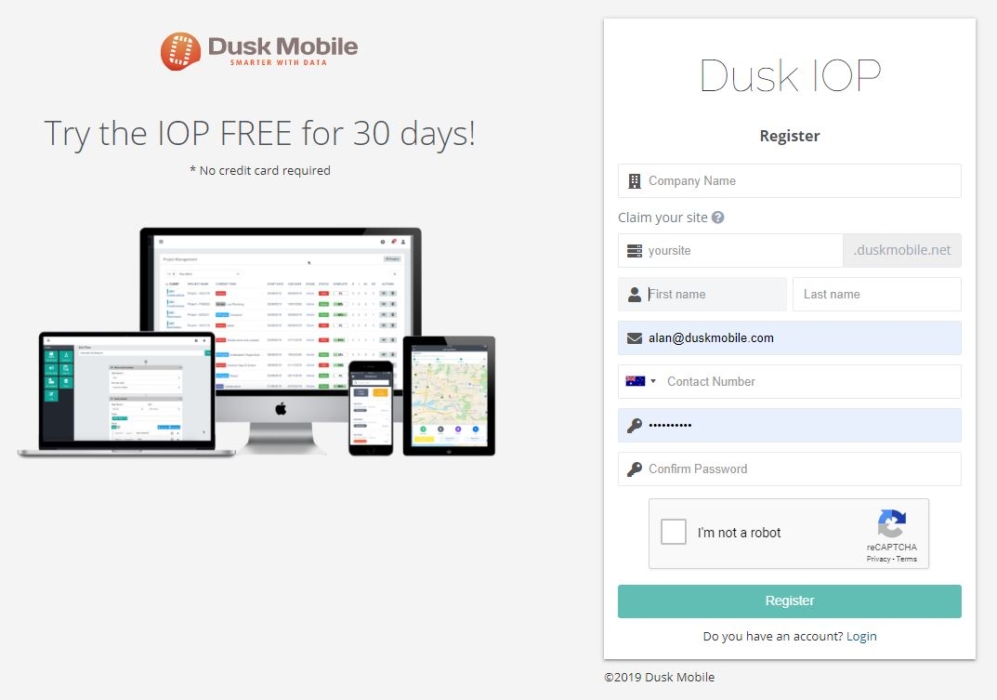
Head over to our registration page for a free 30 day trial here and let’s get underway.
Our customer base has predominantly been utilities and field services companies to date, so some templates for roles in those industries have been included, to show you how good could look.

The roles are permission based with the benefit being organisational reporting structures can be adopted based on authority and sensitivity of data. A General Manager needs a different view to a Divisional Manager and in turn to a Team Leader.
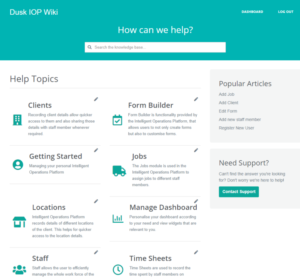
This is a good time to introduce our Wiki, which can be found under Support & Updates. You’ll need to be registered to access it.

Multiple Sources
Feedback during the build process showed us that visualisation was the first part and acting on that visualisation, a close second. The next part was the data sources, which came about in many shapes and sizes. While the IOP has been designed as an API driven platform, many departments, staff members and other systems rely on formats such as CSV. Catering for the dynamic nature of CSV imports leading to actionable insights became a key feature.
The benefit of this functionality is those that are more comfortable with CSV’s or have no other choice, have a world of opportunity available. For example, a daily/weekly/monthly task to present data in an understandable format to customers that previously took 2 days, can now be setup once and automated following the upload of the CSV. Contractual requirements for some of our customers mandate this but their customer or partner may not even open the email or read the report.
That process can now be automated and sent as a PDF or a customer can login to view the information.
Takeaway Tip
Start by validating a use case with the sample data included in the collaborative work management platform. Then talk to your teams or customers and seek feedback ahead of building out a production use case for them.
Try a 30 day free trial of our Intelligent Operations Platform and start seeing the benefits of searchable data, informed decision making and a single, comprehensive view of your business in real time and start collaborating today.
Start your free trial today
Any questions: Our community is here to help in the Support & Updates area!


